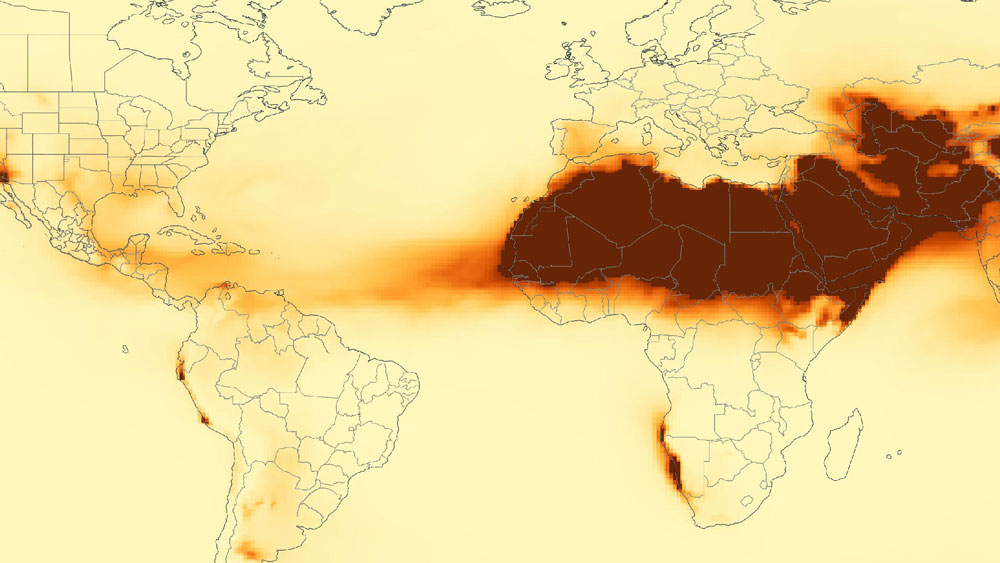
Every summer, weather forecasters blast news about African dust plumes crossing the southern United States. And to most people, it’s just dust — to researchers at Texas A&M University, it’s much more.
Researchers have developed a new method called isotope-resolved chemical mass balance to identify dust participles using isotopic measurements. This new research builds off previous studies where they identified and quantified the dust by determining the elemental composition.
The study was recently published in Environmental Science & Technology.
To do this work, the team, specifically Sourav Das, research assistant and doctoral student in the Zachry Department of Civil and Environmental Engineering, collaborated with Brent Miller, professor in geology and geophysics at Texas A&M, and researchers at the University of Miami.
“We are one of the very few groups that study how this African dust or any kind of global or regional dust sources influence local air pollution by mixing with aerosols from various proximal sources,” said Dr. Shankar Chellam, professor of civil and environmental engineering and A.P. and Florence Wiley Professor III. “Sourav had to first develop a brand-new instrumental method to measure dust’s isotopic and elemental composition and then perform modeling using these measurements.”
Researchers documented this new isotopic analysis procedures in Talanta, the international journal of Pure and Applied Analytical Chemistry.
Previously, Chellam’s students examined and determined the elemental analysis of African dust, but this new method quantifies the isotopic composition of three different metals that serve as unique tracers. An element could be labeled simply as strontium (an alkaline earth metal), but geochemists would carefully label it as strontium 86 or 87, depending on the atomic mass, for example. For dust, they analyzed the rare earth metal neodymium along with strontium and hafnium.
Chellam said to think of the elemental analysis as identifying a full fingerprint. But this new method is like identifying each curve and groove in the fingerprint. Das added that the analogy is that chemically similar sources are like twins with the same face but whose fingerprints would be unique, which can be quantified using isotopes.
“How do we improve the accuracy of not only identifying African dust but also quantifying its contributions (in the air) at low levels before the arrival of the main plume and after its departure?” Chellam said. “To do that is a Herculean task. If it was hard before, it is now 10 times harder to pursue low concentrations.
Accurately and quantitatively tracking Saharan dust across the globe is essential to explain its effects on the Earth’s climate, water and nutrient cycle, and human health. In previous studies, air samples were collected from Barbados and Houston at different times, but this study is distinct because they tracked the same dust plumes from Africa to Houston using NASA satellite images and large-scale models.

“Nobody has ever determined these three isotopes in African dust with relevance to urban air pollution, so there’s no model for that,” Chellam said. “Sourav had to improve the existing model to add the capability of statistically modeling the isotopic fingerprints in addition to the elemental data.”
When looking at the soil from Africa or Houston, the elemental composition is essentially the same. But going deeper into the isotope realm, researchers have quantified how different resuspended crustal material from the two continents are, especially after crossing the Atlantic Ocean.
“We found that when you accurately quantify African dust in Houston, we are also accurately measuring other sources,” Das said. “It’s more a universal method. If you have two or three sources that look similar due to their composition (e.g., dust from North Africa and resuspended dust in Houston), we can distinguish them more accurately. This method of using isotopes is not just applicable to one particular geographical or subject area, but is more applicable to any location and many fields of air pollution.”
Air pollution can be caused by petroleum refining in industrial areas, vehicles and natural factors such as dust and smoke from fires, affecting air quality. According to researchers, there is a clear need for a fuller understanding of the chemical and physical properties of the air to assess potential health impacts of the dust. This isotopic method can be applied and implemented in any metropolitan or remote area in North America, Europe and Asia impacted by desert aerosols.
“There are numerous other possibilities where we can apply this isotope-based method to quantify anthropogenic and natural aerosols polluting urban air,” Das said.
In a separate study published in Atmospheric Environment, researchers also quantified the episodic influences of long-range transatlantic Saharan-Sahelian dust and regional North and Central American biomass burning sources on the air quality in Houston and their effects on the chemistry of rare earth metals using elemental analysis.
Smoke from agricultural and forest fires can cause respiratory and cardiovascular problems and even death. Biomass burning can also result in non-compliance with air quality regulations from the Environmental Protection Agency. Chellam and co-workers determined that biomass burning significantly affected aerosol levels from mid-September to November and between April and June. During their study period, nearly half of the smoke particulate matter came from Central American fires, a quarter from agricultural burning in neighboring states and the remaining quarter from forest fires in Canada and the southeastern United States.